Liquid choked flow in control valves results in either flashing or more often, cavitation. The classical approach to explaining choked flow is by assuming that flow increases linearly with the square root of pressure drop, ΔP until ΔP reaches the choked pressure drop, ΔPchoked, and then immediately becomes fully choked with no further increase in flow. (See the dashed lines in Figure 1.) The term used here for the dividing line between nonchoked flow and choked flow (ΔPchoked) is the terminology used in the 2012 version of the International Society of Automation (ISA) control valve sizing equation standard. Prior to that version of the standard, the dividing line was not given a name, so valve manufacturers made up their own names. Some examples are ΔPallowable, ΔPterminal, ΔPmax and ΔPcritical. In reality, there is a certain amount of rounding out of the graph at the ΔPchoked point, as shown in Figure 1.
Image

The choking curve shape is influenced by the valve orifice geometry. As an example, see the picture of the segment ball valve in Figure 2, which will have a significant choking transition curve. For the segment ball valve, the choking range has a significant transition region because of the configuration of the flow passage. The segment valve has an irregularly shaped flow area. The restricted flow at the narrow ends of the irregularly shaped area creates locally higher shear stresses, which causes cavitation (and eventually choking) to first occur in these regions. Eventually, the entire area will choke as the pressure drop across the valve increases. As a result of the nonuniform distribution of cavitation potential, choking occurs in different locations inside the valve at different flow rates. This causes the choking transition region.
Image

In contrast to the segment ball valve, the globe valve has a very symmetrical flow area and as a result, choking will start at approximately all points in the flow path at the same time, resulting in a much shorter transition region between nonchoked flow and fully choked flow.
Flow Curve Complications
No recognized method for calculating the shape of the rounded portion of the graph exists, so the ISA equations plot the dashed lines in Figure 1. For years people used the classical approach (dashed lines) for predicting cavitation damage. The assumption was that if the actual pressure drop was less than ΔPchoked, there would be no cavitation damage and if the actual pressure drop was greater than ΔPchoked, then cavitation damage was present. In recent years, most users and manufacturers of control valves have recognized that operating too close to the ΔPchoked point can result in unacceptable levels of cavitation damage. Figure 3 shows an example of a globe control valve plug that has been damaged by cavitation. In addition to this sort of damage, it is also not uncommon to find mechanical damage caused by the vibration that results from cavitation. The author recalls an instance where the bolts attaching an actuator to the valve had loosened to the point that the actuator flopped around and was about ready to fall off. In another instance of a cavitating valve, an electric motor-operated isolation about 20 feet downstream of the cavitating valve had failed. The motor capacitor had failed because of the high vibration.
This flow curve rounding makes predicting cavitation damage more complicated than simply comparing the actual pressure drop with the calculated choked pressure drop (which assumes the classical discussion of a sudden transition between nonchoked flow and choked flow). It turns out that noise and damage can begin even before the pressure in the main flow stream at the vena contracta drops to FF PV (FF times the vapor pressure of the liquid). Although many published discussions of choked flow, cavitation, and flashing talk about the vena contracta pressure dropping to the vapor pressure, numerous choked flow tests have shown that the pressure at the vena contracta must drop below the upstream vapor pressure for vaporization to take place in the vena contracta and for flow to choke. The ISA formula shown in Figure 1 for FF gives a good approximation of how much below the upstream vapor pressure the vena contracta pressure must drop for flow to choke.
Cavitation Damage

Cavitation Stages
The first stages of cavitation begin when the average pressure in the main flow jet at the vena contracta is still above FF times the vapor pressure of the liquid. (See Figure 4.) At points of abrupt increase in flow area, the streamlines that are attached to the physical boundaries of the valve can separate and when they do, they form vortices or eddies. The rotational velocity in the eddies can be high enough that the local pressure inside an eddy drops below the vapor pressure and vapor bubbles form. As the eddy's rotational velocity decreases, the pressure surrounding the vapor bubbles increases and the bubbles collapse. Vortices also form in the shear layer adjacent to the main jet where high-velocity gradients exist, and these are also potential sources for cavitation.
Image
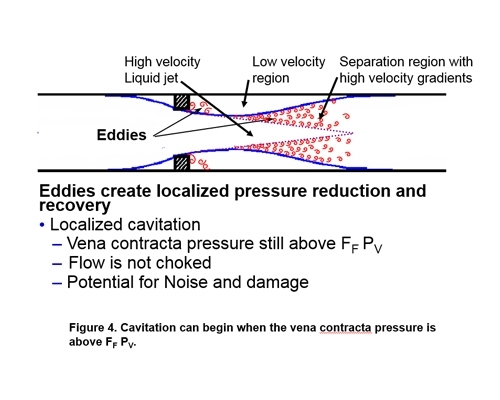
This level of cavitation has the potential to generate noise and cause damage even before the flow curve starts to deviate from a straight line.
As the pressure drop across the valve is increased, the velocity at the vena contracta increases, and finally the pressure at the vena contracta drops to FFPv. (See Figure 5.)
Image
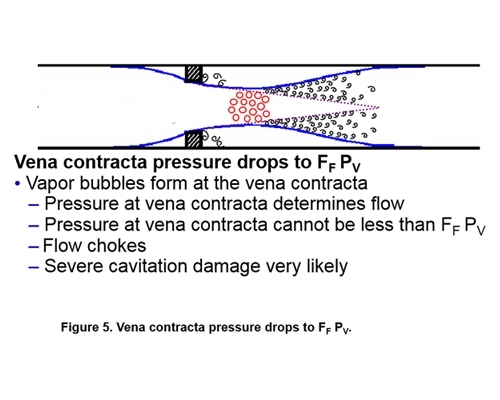
The flow through a control valve depends on the pressure at the vena contracta. Since it is not possible for the pressure at the vena contracta to be less than FF times the vapor pressure of the liquid, the flow becomes choked; that is, further decreases in downstream pressure do not cause the flow to increase further.
Operating a valve at or beyond the choked point calculated from FL (ΔPchoked) is almost sure to result in excessive noise and cavitation damage.
Cavitation Damage Prediction
The concern with cavitation is twofold: the potential for high noise levels and the potential for valve damage. Several reliable methods exist for predicting valve noise, including methods published by the International Electrotechnical Commission, the ISA, and the German VDMA. No standard exists for predicting cavitation damage.
Some valve manufacturers predict the beginning of cavitation damage by defining an incipient damage pressure drop, which this author will call ΔPID, using a KC factor. (See the formula in Figure 6.)
Image

Initially, valve manufacturers defined ΔPID and KC as the point where the actual flow curve deviates from a straight line by 2 percent. It was later determined that this was not necessarily coincident with the beginning point of cavitation damage, which is what we are really interested in predicting. Some manufacturers now evaluate actual application experience with cavitation damage and assign what are, hopefully, meaningful values of KC to their valves. One manufacturer, for example, uses a KC for their stem-guided globe valves that is equal to 0.7, which it says experience has shown does a good job of predicting the point at which cavitation damage begins.
Other manufacturers, based on the recommended practice ISARP75.231995, Considerations for Evaluating Control Valve Cavitation, use sigma (σ) to represent various levels of cavitation. These valve manufacturers use the values of σmr. (The manufacturers recommended the value of sigma.) Sigma is defined as (P1 PV) / ΔP. σmr and KC are reciprocals of each other and thus convey similar information, though the recommended practice includes additional parameters. Higher values of KC move the point of incipient damage closer to ΔPchoked, where lower values of σmr do the same.
It is also important to understand that FL is not a cavitation parameter. It is a choked flow parameter, and its only use is to determine the theoretical choked flow point based on the assumption that the choked flow point, ΔPchoked, is the intersection of the two straight dashed lines shown in Figures 1 and 5 in red and green. Using FL as a cavitation parameter is almost sure to result in unacceptable levels of cavitation damage.
Cavitation Method History
The method for predicting cavitation damage that the author is most familiar with, and which has been used with success for more than 25 years is based on the fact that the same thing that causes damage also causes the noise, namely the collapse of vapor bubbles.
The idea of correlating noise with cavitation damage surfaced in 1985 when Dr. Hans Baumann published an article in which, based on some limited damage tests, he established a maximum sound pressure level (SPL) of 85 dBA as the upper limit to avoid unacceptable levels of cavitation damage in butterfly valves.2 To verify this premise, the valve manufacturer with whom the author was associated for many years, Metso, did a study of many applications, wherein some cases cavitation damage was minimal and in others it was excessive. The conclusion of the study was that it is possible to predict that damage will be within acceptable limits if the predicted noise level is below limits established in the study. In the case of a 6-inch valve, the limit turns out to be 85 dBA.
Because the same number of bubbles per second that result in a sound pressure level of 85 dBA and present a potential for cavitation damage in a 6-inch valve are more spread out and less concentrated in an 8-inch valve, more bubbles are allowed per second and hence a higher noise level is present in larger valves. Applying the same reasoning, the number of bubbles per second that would be tolerable in a 4-inch valve would be more concentrated in a 3-inch valve, so to avoid cavitation damage in the smaller valve, the noise limit has to be lower. The SPL limits established in the study (based on noise calculations using VDMA 24422 1979), to avoid cavitation damage are:
- Up to 3-inch valve size: 80 dBA
- 4- to 6-inch: 85 dBA
- 8- to 14-inch: 90 dBA
- 16-inch and larger: 95 dBA
Note that regardless of the noise calculation, the actual pressure drop must be less than the choked pressure drop because experience has shown that operating above the choked pressure drop is almost certain to result in damage in most control valve applications.
Article featured in Flow Control Magazine.